Creating Your Regression Analysis Calculator
We call ourselves data-focused creatives, but we could also be called professional juggalars. Our team is constantly working with ongoing and upcoming tests, and the secret to balancing both is working smarter. One way we keep future tests on track is by fully analyzing the results of previous outcomes, and we do that through regression analysis.
Regression analysis — a statistical modeling technique — allows you to analyze past results to predict future outcomes. We broke down the concept and how we use it to help our clients in a previous Creative Test Kitchen post, and now we’re ready to help you inform your landing page testing based on a model for social engagement created by our own Digital Marketing Analyst Kaitlin Claywell in her article, Beating the Instagram Algorithm: IG Engagement Calculator & How To. Gather your information, open a new spreadsheet, and pour another cup of coffee. It’s time to build your regression analysis calculator.
Step 1: Arrange your data
Thanks to modern technology, crunching the numbers isn’t hard — the trickiest part is organizing the data correctly. Start by gathering your previous test results in the field you’re currently focused on, like headline copy or button text.
Up first in any regression analysis spreadsheet comes the dependent variable. When discussing landing page optimization the dependent variable is conversion, so you will list those results in Column A. The following columns will represent independent variables; if we’re talking about headlines these might be question headlines, statement headlines, seasonal headlines, evergreen headlines, local headlines, etc. All independent variables need to be viewed as a yes-or-no question to your dependent variable, and if the answer to that question is “yes” you put a “1” in the correlating cell. If not, place a “0”. Remember that any given test you’re including in your data may qualify for multiple independent variables. And be specific with your questions — the more detailed the variables, the more likely you are to predict accurate results in the future.
Sound confusing? Once you get started it’s easy to replicate. Let’s dig into a simple example. Imagine these are a sampling of your previous test results. When you’re analyzing your own data you will want more past tests to include than these four; we’re just breaking the topic down for easy digestion.
Headline |
Conversion |
|---|---|
Leaky Roof in Denver? |
+7.9% |
Save $200 on Roof Repair Now |
+12.2% |
Repair Your Roof This Winter and Save $200 |
+1.1% |
Have You Checked Your Roof This Winter? |
-2.3% |
You’ll now move those results into a fresh spreadsheet, seeing which match with the independent variables.
Conversion |
+7.9% |
+12.2% |
+1.1% |
-2.3% |
|---|---|---|---|---|
Question |
1 |
0 |
0 |
1 |
Seasonal |
0 |
0 |
1 |
1 |
Problem-Based |
1 |
0 |
0 |
0 |
Offer |
0 |
1 |
1 |
0 |
Localized |
1 |
0 |
0 |
0 |
Conversion |
Question |
Seasonal |
Problem-Based |
Offer |
Localized |
|---|---|---|---|---|---|
+7.9% |
1 |
0 |
1 |
0 |
1 |
+12.2% |
0 |
0 |
0 |
1 |
0 |
+1.1% |
0 |
1 |
0 |
1 |
0 |
-2.3% |
1 |
1 |
0 |
0 |
0 |
In addition to more dependent variables in your final document, you’ll likely benefit from more independent variables. There is no set minimum you must use, but like any data prediction the more you can include the more accurate your results may be.
Step 2: Run the calculator
Thanks to the wonderful world of data automation, this process only gets easier from here. You may paste your table into an external regression analysis tool, such as StatPlus, or highlight the cells and click Data Analysis > Regression under the Data tab when working in Excel.
Once you run your numbers through a regression or multilinear analysis, you’ll have incredibly helpful — although potentially confusing to read — results. Let’s break them down.
Step 3: Analyze your results
Your results will come in the form of an equation that reads something like...
# Dependent Variable = Baseline Positive/Negative Number 1 * Independent Variable 1 Positive/Negative Number 2 * Independent Variable 2 Positive/Negative Number 3 * Independent Variable 3 Positive/Negative Number 4 * Independent Variable 4
Your baseline in this equation is the conversion you could confidently expect from any given test. Next up comes a positive or negative number * the first independent variable. That number represents the increase or decrease you should expect from the test that follows. Is it a high positive number? That means past tests have shown this is historically a high-performing test. Way to find a winner!
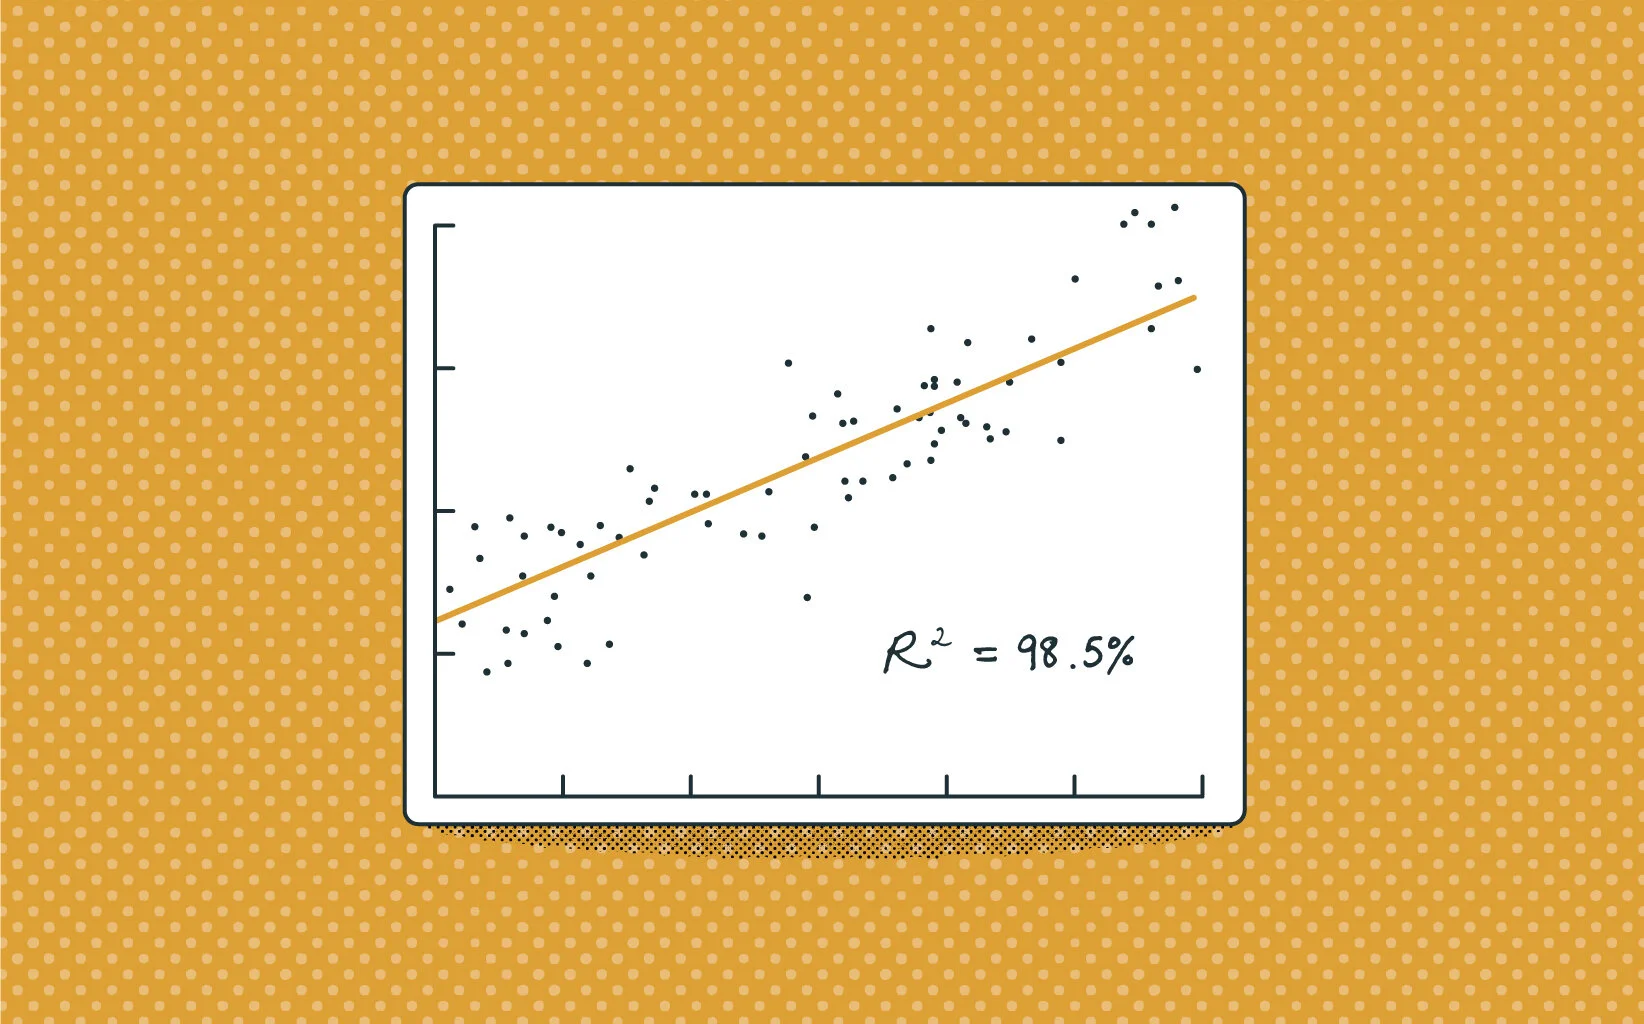
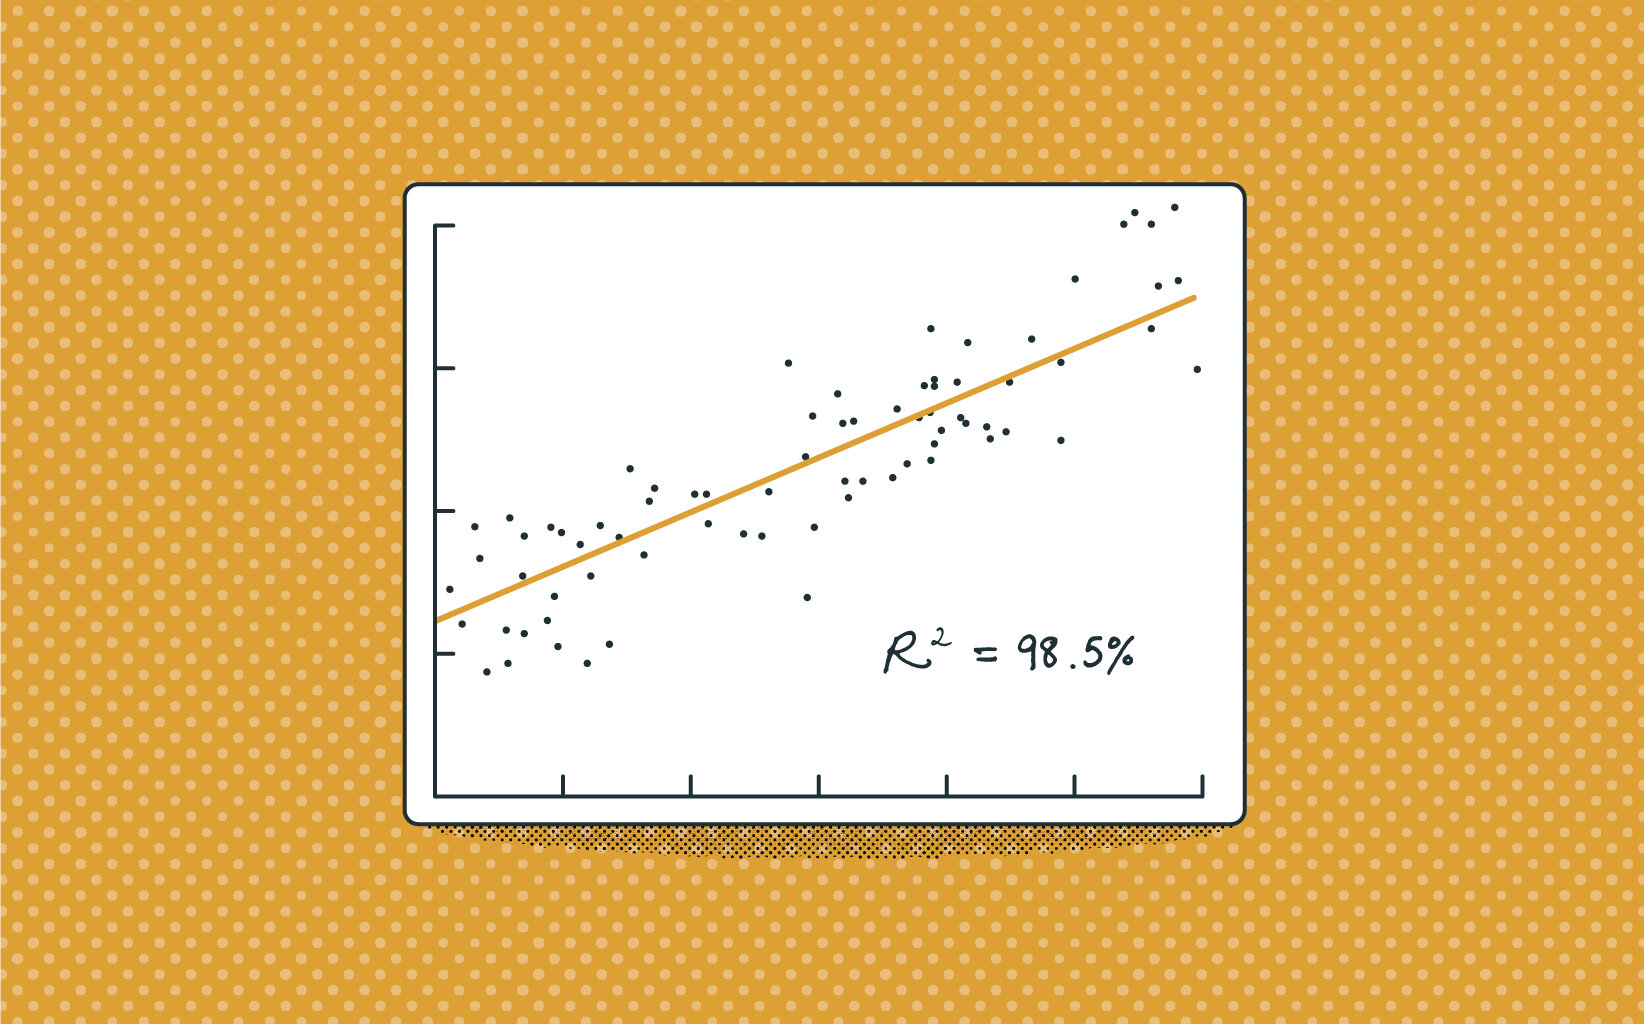
It’s important to remember the accuracy of the model is based solely on the data inputted. As always with any statistical test, check the R-squared (R 2 ). Those newer to the field can simply remember these numbers are literally representing points on a line, and the farther they are from the line (or 1) the less confidence you should have in the results. Different questions or tests may increase the accuracy.
Next Steps
As you continue to test your ability to accurately predict future outcomes using regression analysis will only improve. At Full Cup, we use this technique to find new areas of growth for our clients and help track what didn’t work in underperforming tests. From copy choices to design changes, there are a myriad of potential dependent variable categories to focus on when tracking your landing page conversion. Create your next test based on the positively influenced variables and see if they can improve outcomes — then continue adding those results to your regression analysis calculator as you grow your library of testing data.